One Tool. Five Timeframes. Four Markets. How to Trade and Invest with Ballad Markets Technical Analysis
Ballad Markets is an AI-powered trading intelligence platform combining macro sentiment analysis (AMAIA), institutional price action pattern detection…
ABOUT BALLAD MARKETS
Ballad Markets is an AI-powered trading intelligence platform combining macro sentiment analysis (AMAIA), institutional price action pattern detection (Price Action AI), and automated trade execution (DELIA). balladmarkets.com
Most traders pick one timeframe and stick to it. Scalpers ignore the weekly. Long-term investors ignore the hourly. The result: blind spots that cost money at exactly the wrong moment.
Ballad Markets Technical Analysis covers five distinct timeframes from sub-2-hour scalps to 1-year+ long-term positions across four asset classes: Crypto, Indices, Commodities, and Stocks. One tool, full market context, structured decision-making at every level.
The Five Timeframes And What Each One Is For
Scalp under 2H – Nasdaq 100 (NDX)
Short windows, tight levels, fast decisions. NDX at 30,224 with key levels packed within 0.7% – major resistance at 30,435, major support at 30,012. Guide stop at 30,103. Recommended exposure: 1-2% of capital.
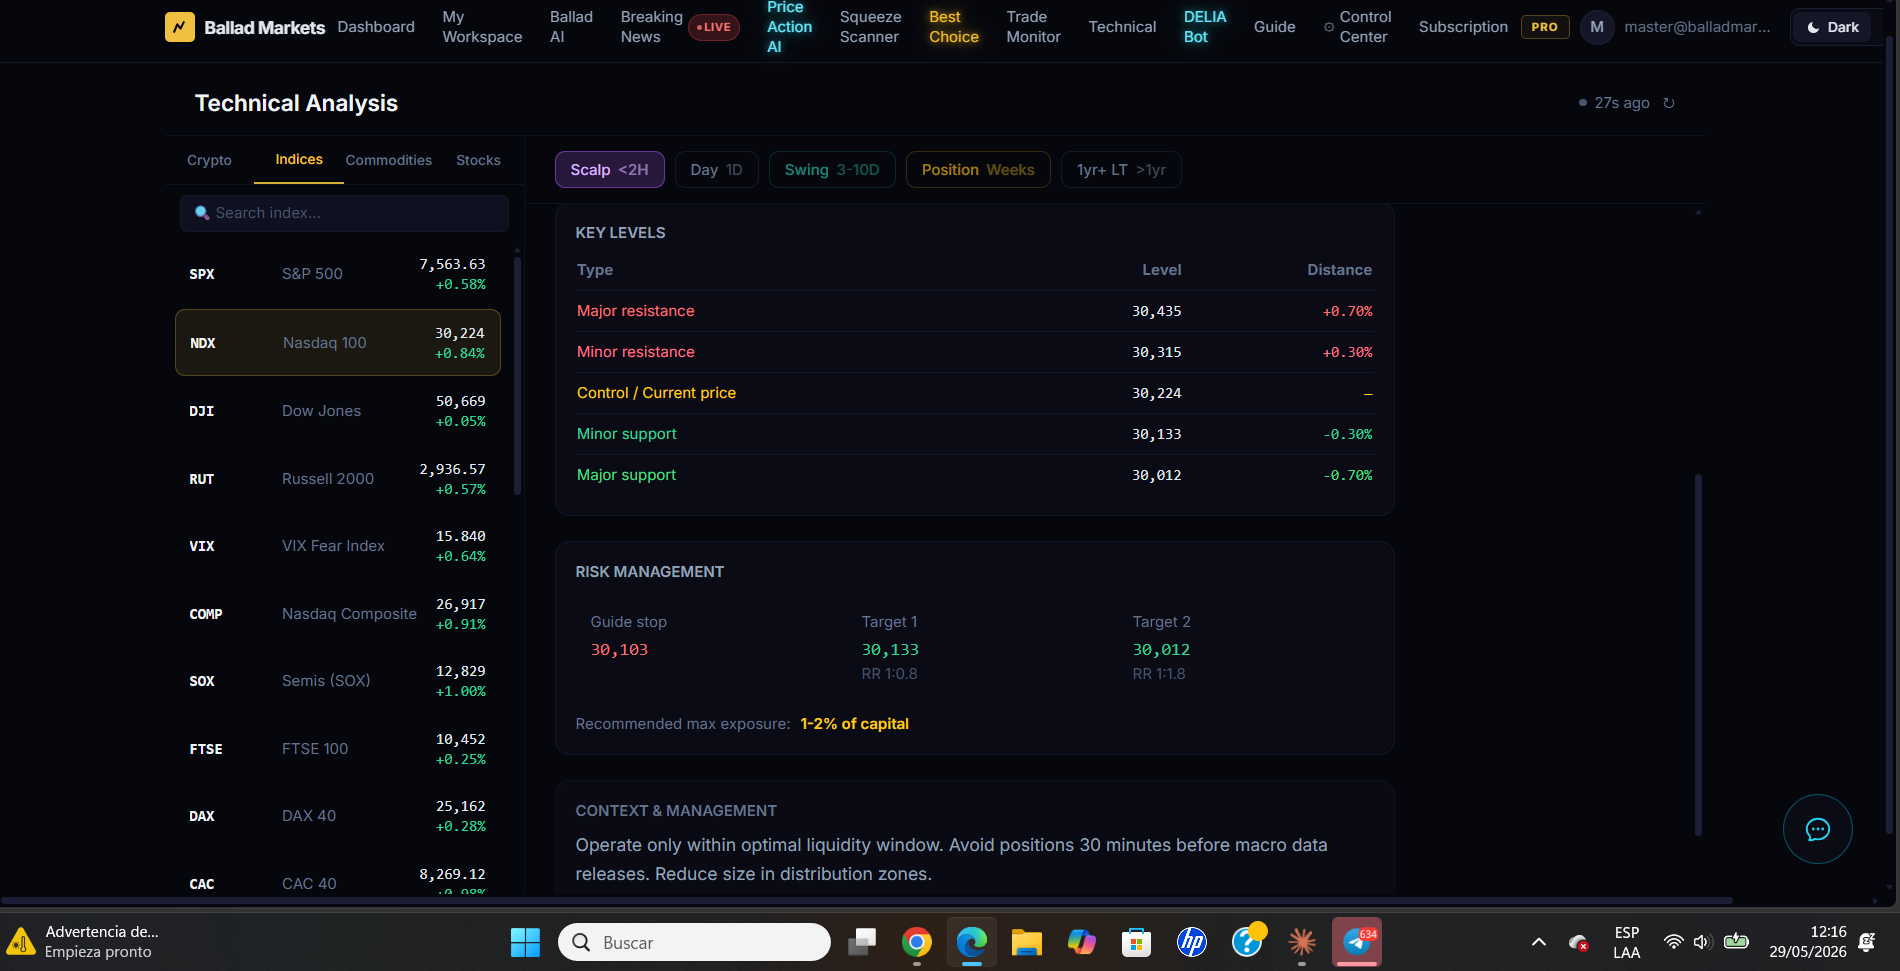
The system context is explicit: Operate only within optimal liquidity window. Avoid positions 30 minutes before macro data releases. Reduce size in distribution zones. This is precision trading – defined entry, defined risk, defined context.
Day 1D – Gold (XAU)
Gold at $4,557 – NEUTRAL bias. The tool gives day traders two scenarios before the session opens: a primary thesis (expected daily range 4,511-4,603, neutral while holding 4,511 on H4 close) and an alternative scenario (H4 close below 4,511 invalidates bullish bias, opens correction to 4,466).
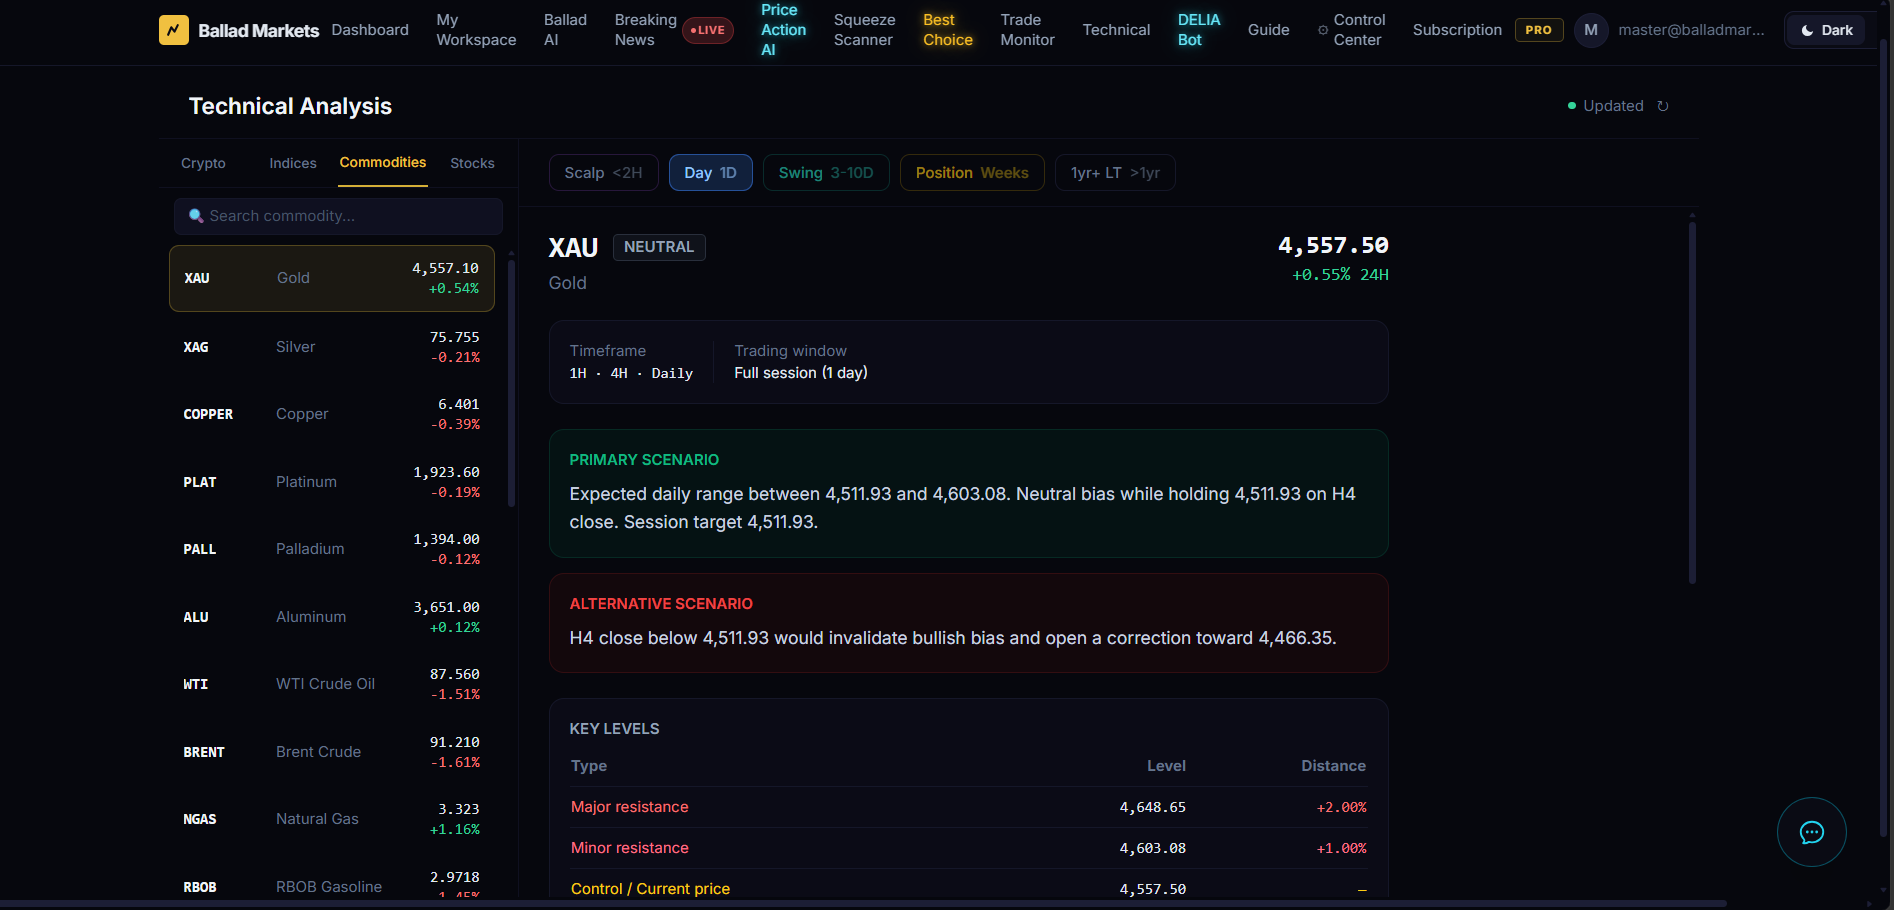
Two scenarios mean no surprises. You know exactly what invalidates your thesis before you enter – and what to do when it happens.
Swing 3-10D
Multi-day moves targeting institutional compression zones and breakout levels. Ideal for traders who cannot monitor screens all day but want meaningful setups with 3-10 day holding windows. The system identifies where smart money is building positions – and where it is likely to distribute.
Position Weeks – Bitcoin (BTC)
BTC at $73,585. Major resistance at 99,371 (+35%). Major support at 47,845 (-35%). Two take-profit targets with clear risk/reward: T1 at 60,359 (RR 1:0.9), T2 at 47,845 (RR 1:1.7). Recommended capital exposure: 5-8%.
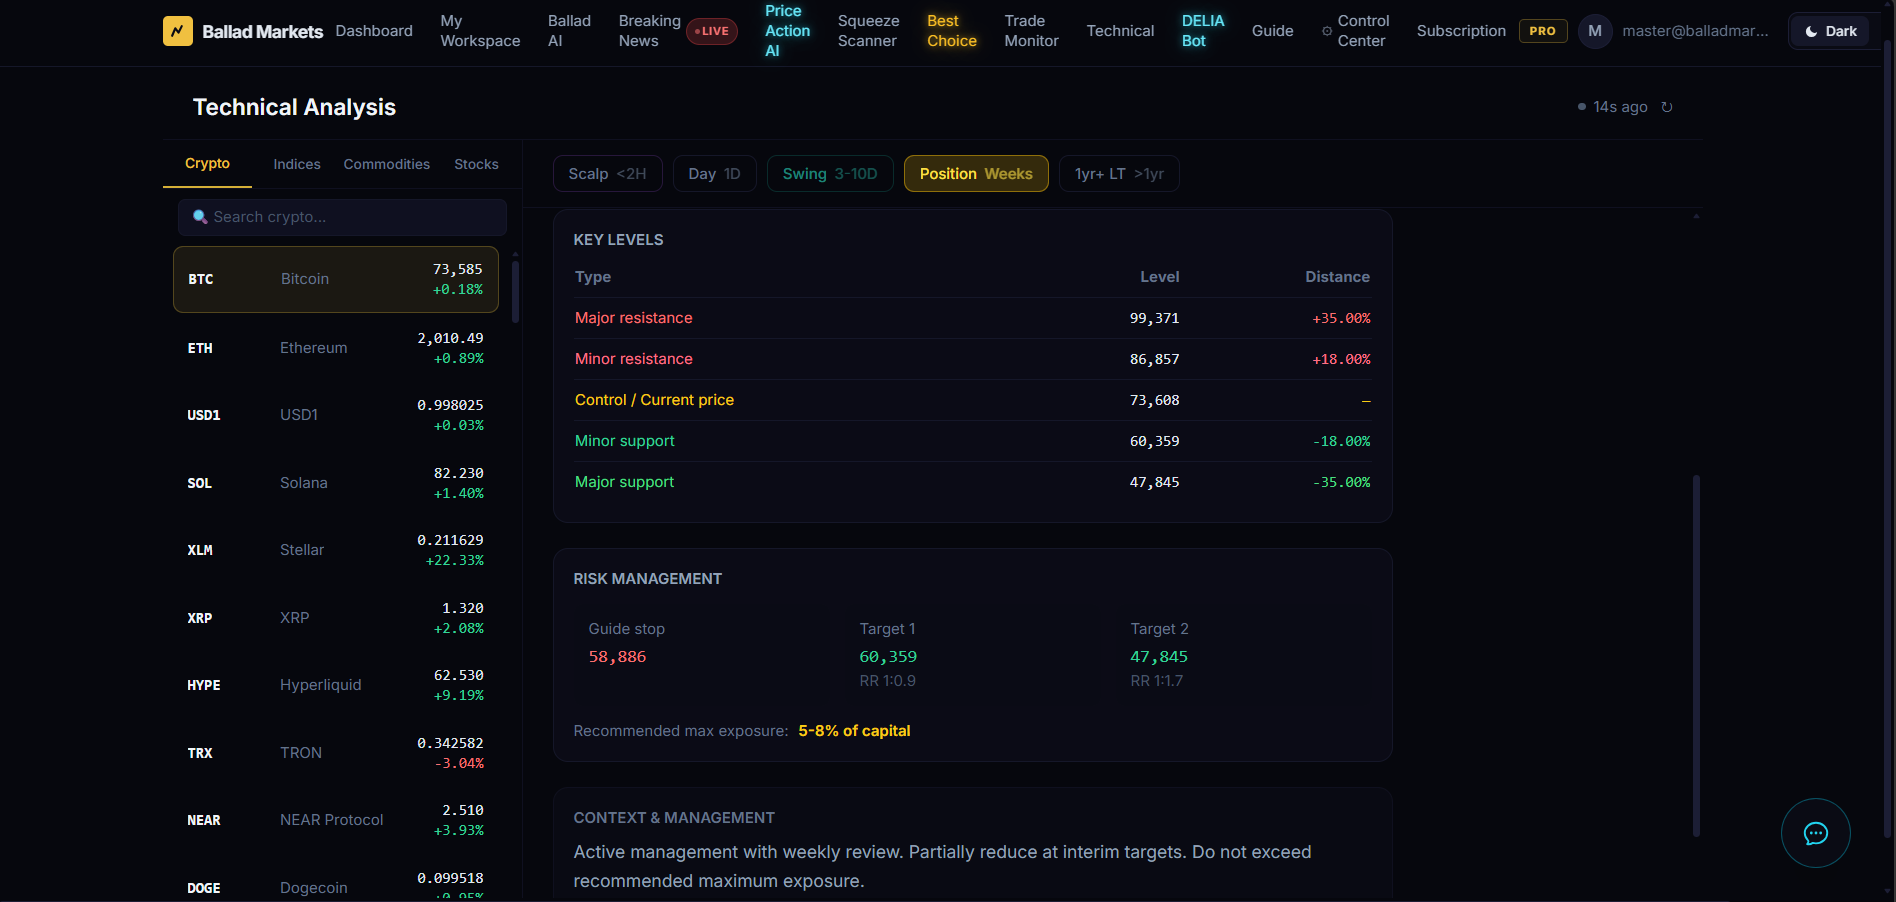
Context: Active management with weekly review. Partially reduce at interim targets. Do not exceed recommended maximum exposure. Position trading is about holding a thesis – and the system tells you exactly when to reduce and when to hold.
1yr+ Long Term – Apple (AAPL)
Apple at $312.51. Major resistance: $437.51 (+40%). Major support: $218.76 (-30%). Guide stop: $256.26. Recommended capital: 8-15%.
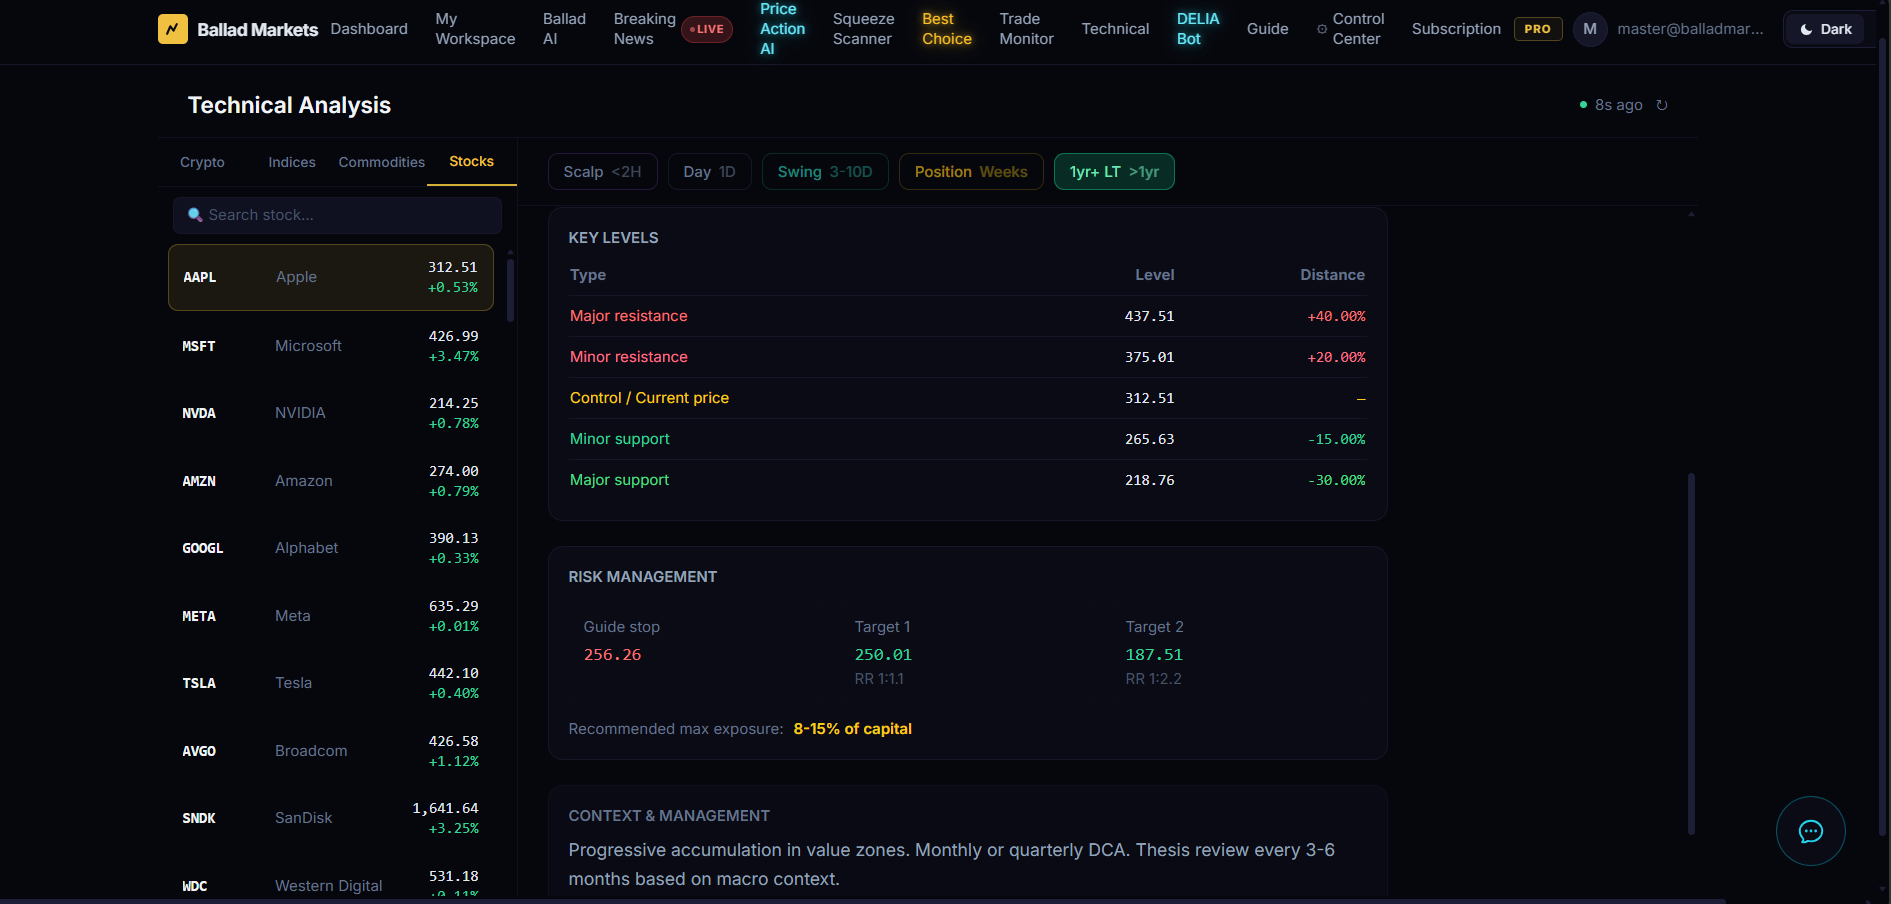
Context: Progressive accumulation in value zones. Monthly or quarterly DCA. Thesis review every 3-6 months. This is investor-grade analysis – not just where price is today, but where to build a position with patience over months.
Four Asset Classes – One Framework
Most retail traders are limited to one market. The Technical Analysis tool covers all four with the same structured framework:
| Asset Class | Examples | Best Timeframes |
|---|---|---|
| Crypto | BTC, ETH, XLM, HYPE, SOL, XRP | Scalp, Swing, Position |
| Indices | S&P 500, Nasdaq 100, DAX, FTSE, VIX | Scalp, Day, Swing |
| Commodities | Gold, Silver, WTI, Brent, Natural Gas | Day, Swing, Position |
| Stocks | AAPL, NVDA, MSFT, META, TSLA, AMZN | Swing, Position, 1yr+ |
Confluence With Price Action AI
Technical Analysis defines where price is relative to key levels. Price Action AI identifies when institutional patterns appear at those levels. Used together:
- TA says: BTC major support at $47,845 – high-interest accumulation zone
- Price Action AI says: 3 Drive pattern forming on 4H, score 88/100
- Result: structural level + institutional pattern = high-conviction, defined-risk setup
Confluence is what separates trades from guesses. One signal can be noise. Two independent signals pointing to the same level are a thesis.
Long-Term Investing: Profit-Taking and Strategic Buy Backs
The 1yr+ timeframe answers two questions that most long-term investors never ask systematically:
When to Take Profits
Minor and major resistance levels are your profit-taking targets. AAPL at $375 (minor resistance) and $437 (major resistance) – the system tells you where the market has historically struggled to go higher. Selling into strength at resistance is not timing the market – it is respecting structural levels with a pre-defined plan.
Where to Buy Back With Patience
After profit-taking at resistance, major and minor support levels show you where to re-enter. AAPL major support at $218.76. BTC major support at $47,845. These are levels where institutional buyers have historically absorbed selling pressure. The framework: sell into strength at resistance, wait, accumulate at support. Reduce your average cost, maximize long-term returns, keep the thesis intact.
For DCA (Dollar Cost Averaging) investors, the system removes the guesswork from when to buy more. Instead of buying on a fixed schedule regardless of price, you buy when price reaches structurally significant value zones – where the risk/reward is most favorable.
The Takeaway
Most technical analysis tools give you a chart and leave the interpretation to you. This tool gives you the levels, the bias, the timeframe context, the risk management parameters, the capital exposure recommendation, and the trading context – for four asset classes and five timeframes.
Whether you are scalping the Nasdaq for 30 minutes or accumulating Apple stock for the next 18 months, the framework is the same: know the levels, manage the risk, let time do the rest.
All analysis shown is for educational purposes only. Past performance does not guarantee future results. Trading and investing involve significant risk of loss. This post does not constitute financial advice.
Want access to all five timeframes across all four markets?
Ballad Markets gives you Technical Analysis, Price Action AI, AMAIA, and DELIA in one platform. Free account available.